Visualizing your environment
In this tutorial we will demonstrate how you can use EAGERx to visualize parts of your environment.
EAGERx has a built-in GUI to visualize your environment. Moreover, as EAGERx is build on top of ROS you can use many of the support ROS tools. These tools can give valuable insights on the workings of your environment.
Note
The ROS tools we cover in this tutorial (e.g. rqt_plot) are per default included in the desktop and
desktop-full ROS installation.
The tools can be manually installed with the lines below. Replace <DISTRO> with the supported ROS distributions
(noetic, melodic).
sudo apt-get install ros-<DISTRO>-rqt
sudo apt-get install ros-<DISTRO>-rqt-common-plugins
Graphical user interface
After creating the Graph for our environment, we can inspect it using the GUI. Note that we need to install it first if you haven’t done so yet:
pip install eagerx-gui
Next, we can open it by calling gui():
graph.gui()
By clicking on Show Graph, we can inspect the graph in the GUI. The output you will see should look something like this:
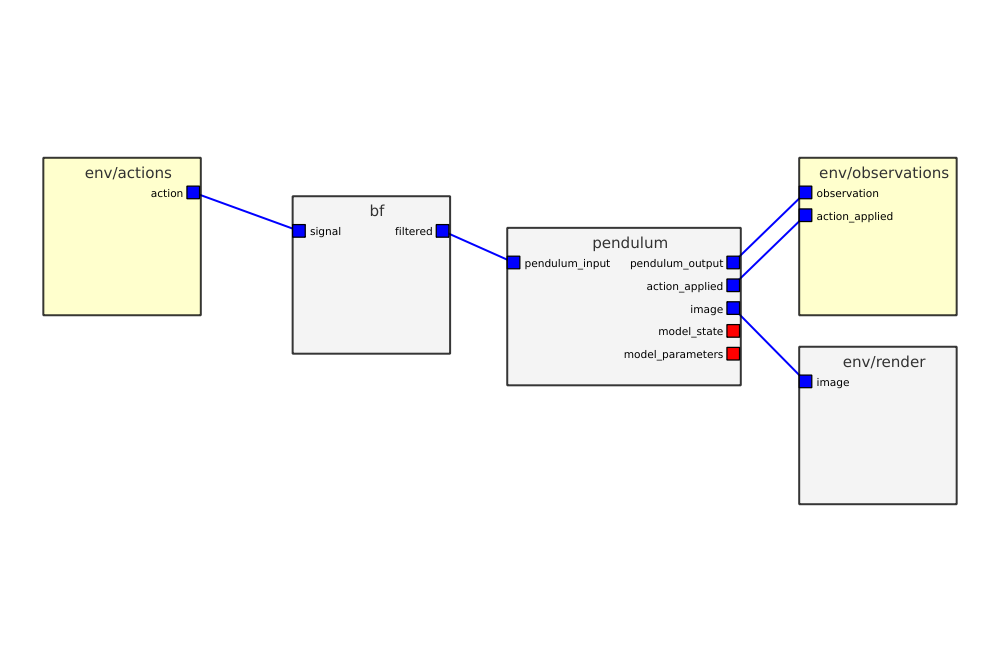
Screenshot of the EAGERx GUI.
The GUI also provides functionalities for constructing a Graph.
So we could also have created the exact same Graph from scratch using the GUI.
This is demonstrated in the video below:

The construction of an environment via the GUI.
Live-plotting
Note
Live-plotting is currently only supported when the Ros1 Backend is selected.
In robotics it is crucial to monitor the robot’s behavior during the learning process. Luckily, inter-node communication within EAGERx can always be listened to externally, so that any relevant information stream can be trivially monitored on-demand.
Inter-node communication within EAGERx is always advertised as a topic that can be listened to externally, even
when nodes are interconnected within the same process. Therefore, we can leverage existing tools from ROS such as rqt_plot.
rqt_plot provides a GUI plugin visualizing numeric values in a 2D plot using different plotting backends.
See here for more details on this tool.
Topic addresses for outputs follow the naming convention:
<env_name>/<node_name>/outputs/<cname>: (e.g. /rx/controller/outputs/reference).
rqt_plot /rx/viper/sensors/ee_pos/data[0]:data[1]:data[2]
This will open a live-plot of the x, y, and z coordinate of the end effector similar to the one below.
Live plot of the x, y, and z coordinate of the end effector using rqt_plot.
Note
The computational overhead of publishing all node outputs as topics is minimal when there are no subscribers. In other words, there is only computational overhead when external source (e.g. rqt_plot) is listening to the advertised topics. Once the external source unsubscribes, the overhead is again reduced.
Computation graph
rqt_graph is a ROS tool that provides a GUI plugin for visualizing what’s going in the ROS computation graph that EAGERx
creates for you based on the nodes, objects, and their interconnections.
To visualize the graph, you can run the following command in a separate terminal while your environment is running:
rosparam set enable_statistics true
rqt_graph
This will provide you with an overview similar to the one below:
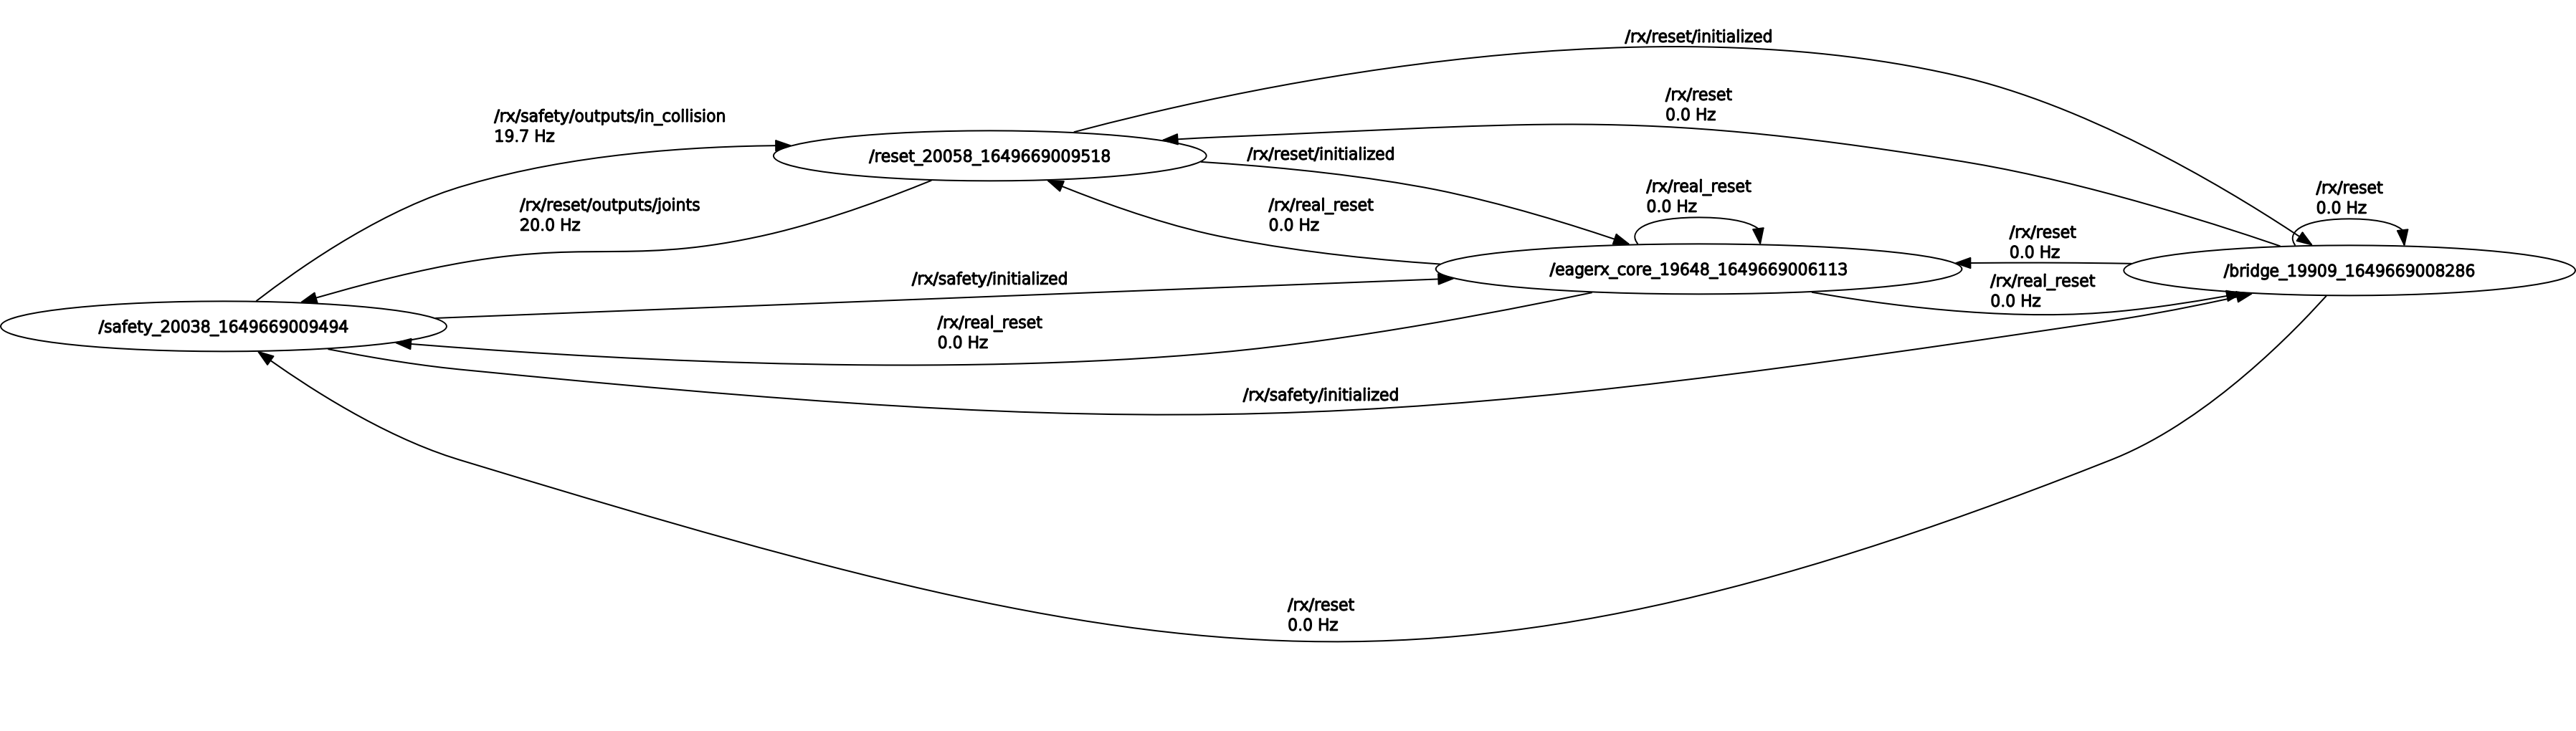
The ROS computation graph that EAGERx creates for you.
In the top left, you can refresh to update statistics about the messages that are passed in the graph. Also you can select what to visualize:
Nodes only: This will only show the communication (i.e. topics) between nodes that were launched as a
NEW_PROCESS.Nodes/Topics (active): This will show all communication (i.e. topics) that are currently active.
Nodes/Topics (all): This will show all communication (i.e. topics).