Graph
In this section we will discuss the concept of a Graph.
A Graph object can be created to connect inputs and outputs of different entities of types Node, ResetNode and Object.
This Graph can be used to initialize an BaseEnv.
Here, we will show an example of how to create such a Graph.
We will connect a Pendulum Object and ButterworthFilter Node.
Also, we will render the Pendulum object, using the render() method.

In this section we will discuss the concept of a Graph.
A Graph consists of a collection of entities of type Node and Object.
The graph is engine-agnostic and should be provided to the BaseEnv, such that communication pipelines can be set up correctly.
# ROS packages required
from eagerx import Object, Engine, Node, initialize, log, process

initialize("eagerx_core", anonymous=True, log_level=log.INFO)

# Environment
from eagerx.core.env import EagerxEnv
from eagerx.core.graph import Graph
from eagerx.wrappers import Flatten

# Implementation specific
import eagerx.nodes  # Registers butterworth_filter
import eagerx_ode  # Registers OdeEngine
import eagerx_dcsc_setups.pendulum  # Registers Pendulum


if __name__ == "__main__":
  # Define rate (depends on rate of ode)
  rate = 30.0

  # Initialize empty graph
  graph = Graph.create()

  # Create pendulum
  pendulum = Object.make("Pendulum", "pendulum", render_shape=[480, 480], sensors=["pendulum_output", "action_applied"],
                     states=["model_state", "model_parameters"])
  graph.add(pendulum)

  # Create Butterworth filter
  bf = Node.make("ButterworthFilter", name="bf", rate=rate, N=2, Wn=13, process=process.NEW_PROCESS)
  graph.add(bf)

  # Connect the nodes
  graph.connect(action="action", target=bf.inputs.signal)
  graph.connect(source=bf.outputs.filtered, target=pendulum.actuators.pendulum_input)
  graph.connect(source=pendulum.sensors.pendulum_output, observation="observation", window=1)
  graph.connect(source=pendulum.sensors.action_applied, observation="action_applied", window=1)

  # Add rendering
  graph.add_component(pendulum.sensors.image)
  graph.render(source=pendulum.sensors.image, rate=10, display=True)
Note
An Object can be created using the make() method.
Note that in order to be able to make the Pendulum Object, we need to import it: import eagerx_dcsc_setups.pendulum.
This also holds for creating a Node using make() method: import eagerx.nodes # Registers butterworth_filter.
Furthermore, note that we first call the initialize() function.
This starts a roscore and allows to initialize the communication pipelines.
Also can be seen here that nodes and objects can be added to the Graph using the add() method.
Furthermore, nodes and objects can be connected using the connect method.
For this method it is worth mentioning that if the action or observation argument is specified, the agent’s action or obeservation space will be extended with that action or observation.
The appropriate agent’s action and observation spaces can be created if a SpaceConverter is defined for the connected actuators, sensors, inputs or outputs.
GUI
Having created the Graph, we can inspect it using the GUI.
Note that we need to install it first if you haven’t done so yet:
pip install eagerx-gui
Next, we can open it by calling gui():
graph.gui()
By clicking on Show Graph, we can inspect the graph in the GUI. The output you will see should look something like this:
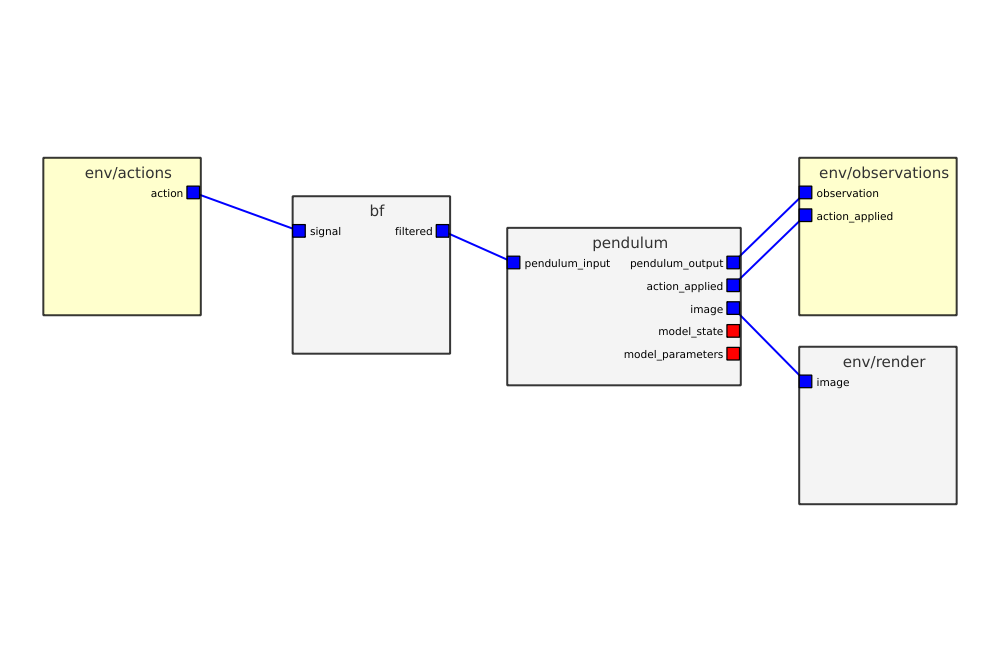
Screenshot of the EAGERx GUI.